Growing Data Literacy in High School Life Science
Contributed By FLHS Science Department
Teaching & Learning Problem
As data becomes increasingly central to decision-making across industries, it's crucial to equip students with the skills to aggregate, analyze, and make sense of vast datasets. However, the High School Life Science team at Faith Lutheran Las Vegas faced a significant challenge: students struggled to interpret and draw conclusions from lab-generated and published data.
The teaching and learning problem identified by the team was, "How do we help students analyze lab-generated or published data presented in various formats?"
Growing Understanding Through Visual Data
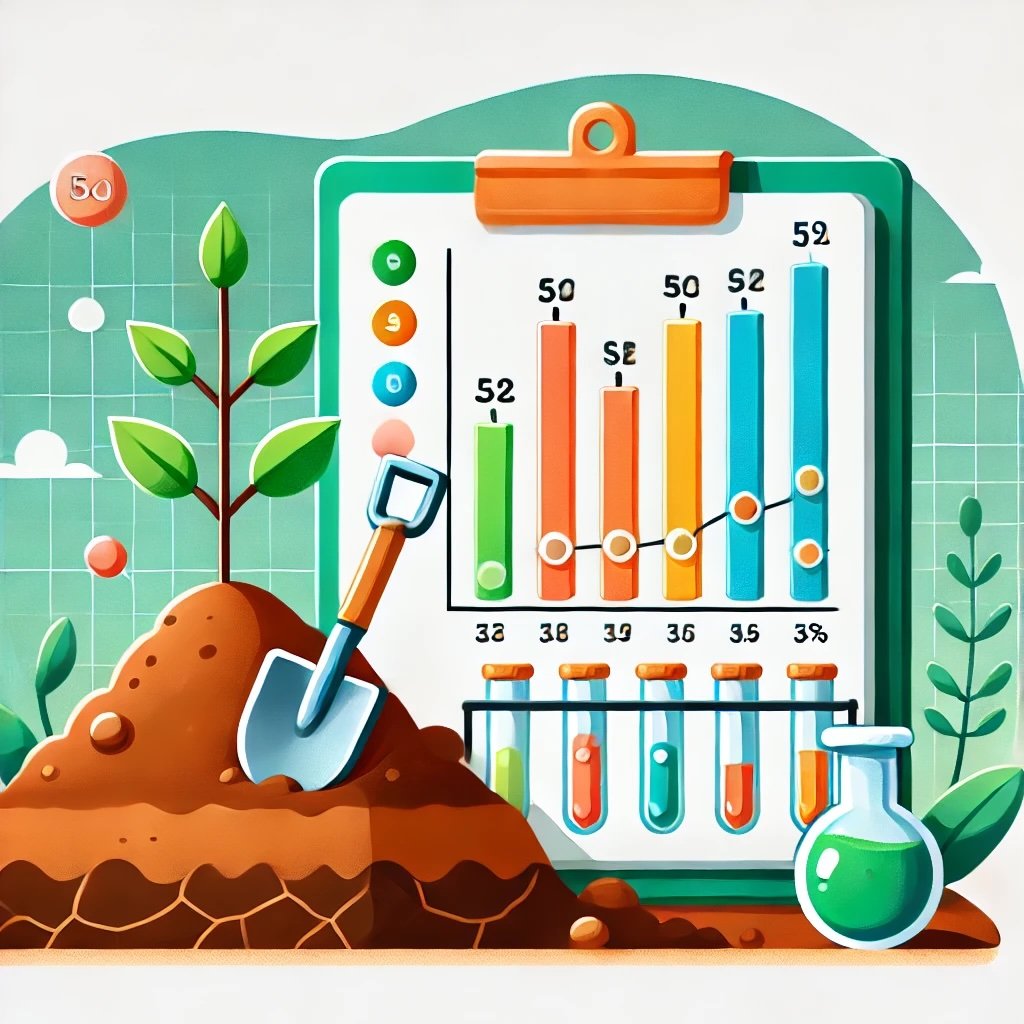
For this lesson, the team focused their efforts on ecology, specifically soil conditions for plant growth. Given that students from suburban backgrounds often lack natural knowledge of soil composition and its role in plant health, the lesson was designed to bridge this gap while building skills in data analysis.
To address this, the Life Science PIER team implemented a sequence of instructional strategies aimed at helping students understand and analyze complex data. Several key strategies were implemented, with a focus on hi-lo graphs to present data in a way that made sense to the students.
Key Instructional Strategies
Introducing Hi-Lo Graphs
The team introduced hi-lo graphs to help students grasp the concept of data ranges rather than single points. Using a familiar example—temperature preferences of fish species—the students were guided through constructing these graphs. They were provided with raw temperature data and asked, “How can we represent this in the form of a graph?” The goal was to help students shift their perspective from thinking of data as static points to seeing it as a dynamic range.
After a step-by-step tutorial on creating hi-lo graphs using temperature and stream data, students worked individually and in pairs to construct their own graphs. Collaboration helped students refine their work and correct mistakes through peer review, enhancing their understanding of data representation.
Answering Questions and Drawing Conclusions Based on Data
Once students constructed their graphs, they were given a second set of data to compare with their results. The focus here was on making decisions based on the data, and students were asked to write conclusions that linked their decisions to the graphs they had created. This process allowed students to practice articulating the reasoning behind their conclusions—a critical skill in scientific analysis.
Results and Reflections
To measure the success of the lesson, the teachers collected graphs and conclusion paragraphs from 10 representative students. The team used four criteria to assess the quality of student work:
Identifying optimal plants for soil conditions
Identifying poor plants for soil conditions
Accurately plotting hi-lo graphs
Researching and applying soil conditions for assigned crops
Student Performance
Students performed best on criterion three, with 70% successfully creating hi-lo graphs. The team attributed this success to the detailed tutorial and the opportunities for formative feedback throughout the lesson. In contrast, only 50% of students met the first two criteria related to identifying the best crops for specific soil conditions. The primary challenge was that some students struggled when data did not fit neatly within the expected range.
Lessons Learned and Looking Ahead
One of the most significant takeaways for the team was the importance of formative assessment. Providing students with opportunities to review their work in real-time, identify mistakes, and correct them with peer feedback was a powerful component of this lesson. The team also recognized the need to further address how to help students draw conclusions when data doesn’t match expectations.
For future iterations, the team plans to focus on how to teach students to write strong conclusions even when the data doesn't support the hypothesis. Additionally, they aim to provide more resources and examples of databases to help students locate relevant data more effectively.
By enhancing their ability to interpret complex data, students will be better prepared to navigate the data-rich world they are entering. The team’s commitment to refining this skill set demonstrates the power of thoughtful, evidence-based teaching strategies in building critical thinking skills in today’s students.

